On March 24, I received a letter in the mail [view image] from an observant person who asked if Cathy Dremel's statements about tying salary contracts to cost of living (CPI) were true.
These links to the BATV ViewPoint show and League of Women Voters Forum begin with the exact statement asked about in the letter:
While the CPI statement is technically true, it is misleading. The portion of the contracts linked to CPI is the least significant part in determining how teachers get paid. Currently, the school district's expenses are projected to outstrip revenues, contrary to what the Board President claims.
Note: This post is not a commentary on the equity of teacher pay. I believe that teachers deserve every penny they're worth.
Step and Lane: Crash Course
The most common way teachers get paid in our state is according to the contract negotiated between the School Board and the Teachers' Union which includes a grid system commonly called "step and lane". The contract specifies exactly how much a teacher's salary will be based on the number of years of teaching experience as well as how much graduate education has been completed. The more years of service or the more education received, the higher the salary will be. These contractual values are not related to CPI at all, and the typical increase is far greater than CPI has been over the past decade.
You may view the current teachers' agreement here, and page 56 has the step and lane grid. This step and lane page, specifically, may be viewed at this link.
The CPI Factor
 So where does cost of living factor into how teachers get paid? CPI determines how much the contract grows every year. A step is equal to the number of years teaching, and the lane is based on level of education (e.g. BA8 is Bachelor's Degree plus 8 hours towards a Master's Degree). The years of service and hours of education are two dimensions that set a teacher's salary, and CPI adds a third dimension to this grid. Teachers will get the step increase along with the CPI increase every year, and most of them have the option to move over a lane by going to graduate school[1].
FY2015 Contract
|
FY 2016 Contract
| |||

Teachers move down a step every year
|
CPI
Adjustment
-->
0.23%
|  |
Pay Raise Heatmaps
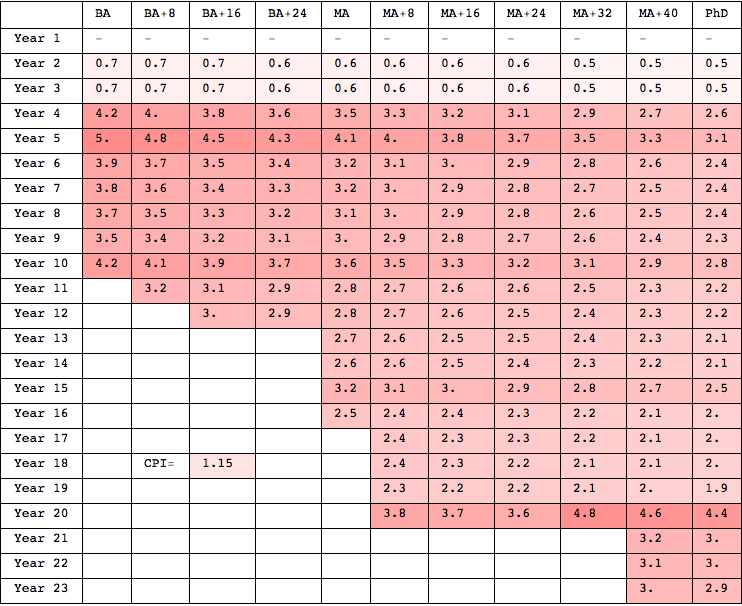
So the question remains, what kind of raises can teachers expect every year? Even without the CPI adjustment, salaries increase from 0.3% to 4.8%. The first grid below shows the contracted raise for every cell in the chart when just a step (ordinary yearly increase) occurs. The second grid shows the percentages including the CPI component, and the last grid shows what a raise looks like if a teacher completes 8 hours of graduate work and moves over a lane.
Percentage Increases (3.5 = 3.5%) for a Step [One More Year Experience]

Percentage Increases for a Step with 2016 CPI Adjustment
Percentage Increases for a Step and Lane Move with 2016 CPI Adjustment

Conclusion
The concerns raised in the original letter are exactly right, and we haven't even discussed issues like benefits. Health care[2] is a problem for every company in the U.S. since costs have been rising over 10% per year for more than a decade. That is a challenge for us all.
All of this is the reason that, as a school district, we need to be as fiscally responsible as possible with the funds we do have. What's most important is being open and honest with the community so that we accurately understand the challenges of the future. Trying to claim that there is no fear of expenses outstripping revenues is the exact type of dishonesty we don't need. My observation is that this is a pattern coming out of the district, and that's why an important part of our platform is to increase transparency.
Be sure to Vote GRO on April 7 for openness, honesty and transparency. Batavia deserves to be fully informed with the full truth.
Footnotes
